 NVIDIA
How to understand the messages in the PeakMiner console? Startup info, pool connection, hashrate table, and share notifications.
What can you see in the miner window?
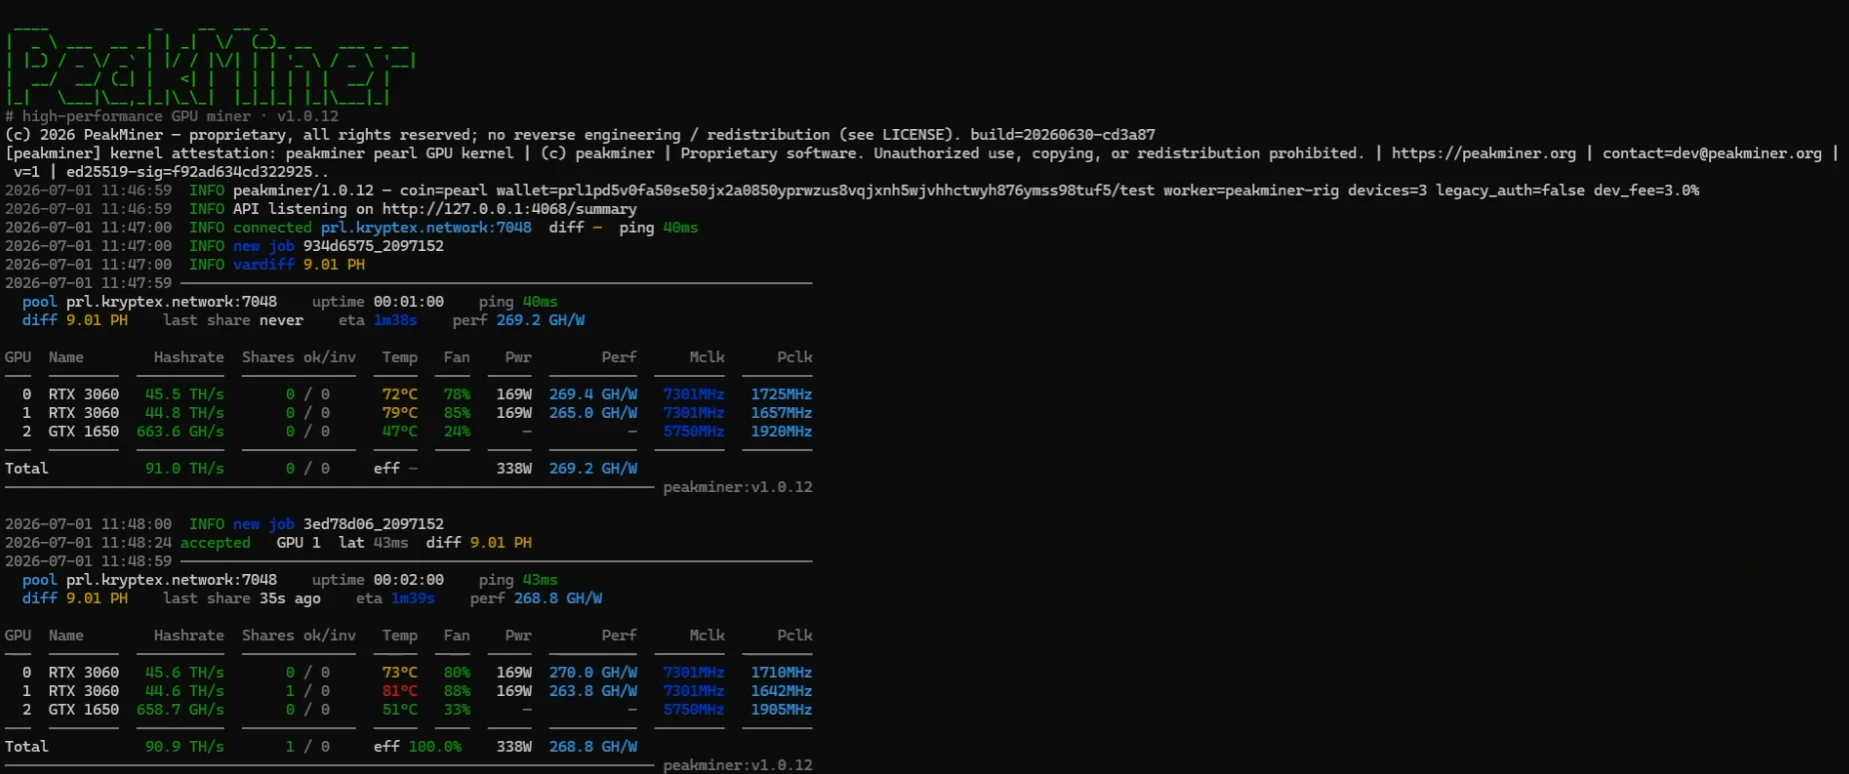
On launch, PeakMiner prints an ASCII banner, its version and build, and a license/attestation line, followed by a startup summary and a series of INFO lines:
INFO peakminer/1.0.12 — coin=pearl wallet=WALLET/WORKER devices=3 legacy_auth=false dev_fee=3.0%
INFO API listening on http://127.0.0.1:4068/summary
INFO connected prl.kryptex.network:7048  diff –  ping 40ms
INFO new job 934d6575_2097152
INFO vardiff 9.01 PH
1. Startup summary coin, wallet, worker, devices, dev_fee — the coin, wallet/worker, number of GPUs in use, and the developer fee.
2. Stats API API listening — confirms the built-in HTTP stats API is up (see Online monitoring).
3. Pool connection connected — the pool address, current difficulty, and ping.
4. Job assignment new job — a new job id was received from the pool.
5. Variable difficulty vardiff — the pool adjusted the share difficulty.
6. Share accepted accepted — printed per share, with the GPU that found it, latency, and difficulty:
accepted GPU 1 lat 43ms diff 9.01 PH
7. Periodic status block, printed about once a minute, and the GPU table below it:
  pool prl.kryptex.network:7048    uptime 00:01:00   ping 40ms
  diff 9.01 PH   last share never   eta 1m38s   perf 269.2 GH/W

GPU  Name      Hashrate    Shares ok/inv  Temp  Fan  Pwr   Perf        Mclk      Pclk
0    RTX 3060  45.5 TH/s   0 / 0          72°C  78%  169W  269.4 GH/W  7301MHz  1725MHz
1    RTX 3060  44.8 TH/s   0 / 0          79°C  85%  169W  265.0 GH/W  7301MHz  1657MHz
2    GTX 1650  663.6 GH/s  0 / 0          47°C  24%  –     –           5750MHz  1920MHz

Total  91.0 TH/s   0 / 0   eff –   338W   269.2 GH/W
8. Status line fields pool, uptime, ping, diff, last share, eta (time to the next expected share), perf (efficiency, GH/W).
9. GPU table columns:
  - GPU — GPU index.
  - Name — GPU model.
  - Hashrate — per-GPU hash rate (switches between GH/s and TH/s by magnitude).
  - Shares ok/inv — accepted and invalid shares from this GPU.
  - Temp — GPU core temperature.
  - Fan — fan speed.
  - Pwr — power draw (shown as «–» on cards without power telemetry, e.g. older GTX models).
  - Perf — efficiency, hash rate per watt (GH/W).
  - Mclk / Pclk — current memory and core clocks, MHz.
10. Total row — sums hashrate and shares across all GPUs, overall power draw, and eff (share acceptance rate, e.g. eff 100.0% once shares have been submitted).

 Best ASICs
 Best CPUs
 Best GPUs
 Mining Calculator
 Overclocking Database